
National 5 Maths
Line of Best Fit
Our choices for textbooks and tutoring:


Page sections 
- Topic content
- Textbook page numbers
- Worked examples
- Past paper questions
- Worksheets
- Notes and videos
Topic content
- Determine the equation of a best-fitting straight line from a scattergraph
- Use the equation of the line of best fit to estimate \(y\) given \(x\).
Textbook page numbers
- Zeta National 5+ Maths pp.273-275
- TeeJay Maths N5 Book 4+ pp.179-183
- Leckie National 5 Maths pp.362-374
Buy our favourite textbook
 Zeta National 5+ Maths
Clear and comprehensive.
Progressive exercises.
Includes answers.
Buy from Zeta Press ![]()
Looking for an N5 Maths tutor?

Try our free, no-obligation tutor search tool.
Click here to find a tutor in your area. ![]()
If this message continues to display, please refresh the page.
Example 1 (non-calculator)

The scattergraph shows the results of an experiment investigating the relationship between two variables \(x\) and \(y\). It has been found that there is a positive correlation.
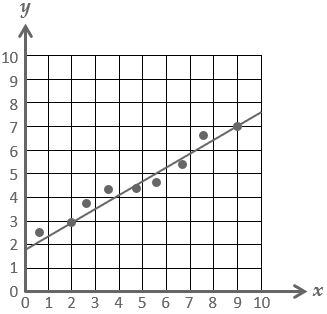
A line of best fit has been drawn.
Find the equation of the line of best fit in terms of \(y\) and \(x\small.\)
Give the equation in its simplest form.
Example 2 (non-calculator)
The scattergraph shows the results of an experiment investigating the relationship between two variables \(P\) and \(Q\). It has been found that there is a negative correlation.
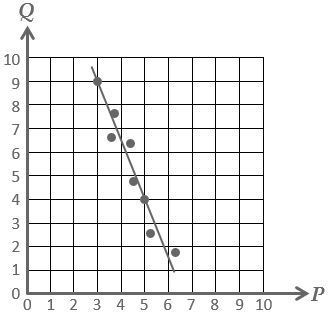
A line of best fit has been drawn.
(a) Find the equation of the line of best fit in terms of \(Q\) and \(P\small.\) Give the equation in its simplest form.
(b) Use your equation to estimate the value of \(Q\) when \(P=4\small.\)
(c) Use your equation to estimate the value of \(P\) when \(Q=3\small.\)
Example 3 (non-calculator)
SQA National 5 Maths 2016 P1 Q5
A cattle farmer records the weight of some of his calves. The scattergraph shows the relationship between the age, \(A\) months, and the weight, \(W\) kilograms, of the calves.
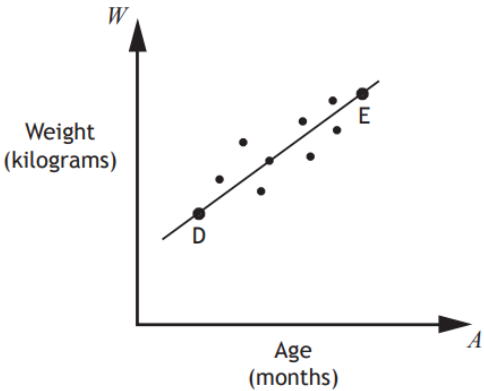
A line of best fit is drawn.
Point D represents a 3 month old calf which weighs 100 kilograms.
Point E represents a 15 month old calf which weighs 340 kilograms.
(a) Find the equation of the line of best fit in terms of \(A\) and \(W\small.\) Give the equation in its simplest form.
(b) Use your equation from part (a) to estimate the weight of a one year old calf. Show your working.
Example 4 (non-calculator)
SQA National 5 Maths 2018 P1 Q7
The cost of a journey with Tom’s Taxis depends on the distance travelled.
The graph below shows the cost, \(P\) pounds, of a journey with Tom’s Taxis against the distance travelled, \(d\) miles.
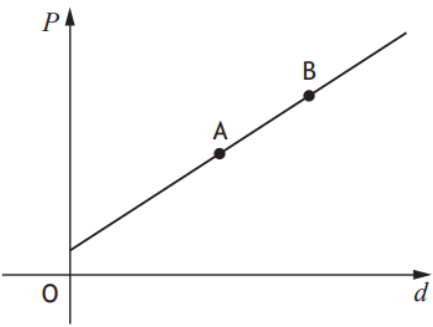
Point A represents a journey of 8 miles which costs £14.
Point B represents a journey of 12 miles which costs £20.
(a) Find the equation of the line in terms of \(P\) and \(d\small.\) Give the equation in its simplest form.
(b) Calculate the cost of a journey of 5 miles.
Example 5 (non-calculator)
SQA National 5 Maths 2019 P1 Q6
The fuel consumption of a group of cars is recorded.
The scattergraph shows the relationship between the fuel consumption, \(F\) kilometres per litre, and the engine size, \(E\) litres, of the cars.
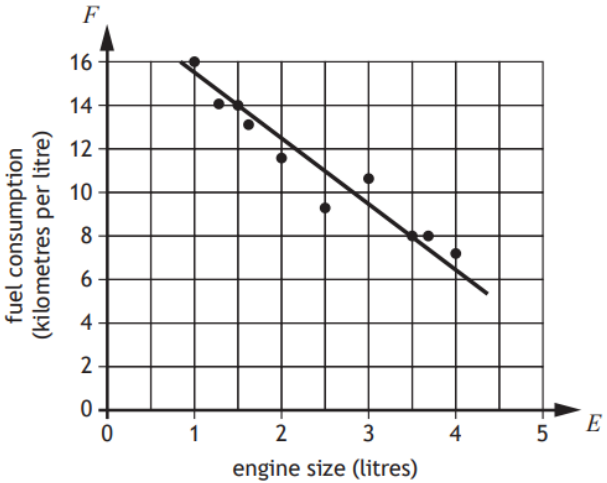
A line of best fit has been drawn.
(a) Find the equation of the line of best fit in terms of \(F\) and \(E\small.\) Give the equation in its simplest form.
Amaar’s car has an engine size of 1.1 litres.
(b) Use your equation from part (a) to estimate how many kilometres per litre he should expect to get.
Example 6 (non-calculator)
SQA National 5 Maths 2023 P1 Q7
A business recorded the salaries of a sample of its employees and the length of time they have worked for the business.
The scattergraph shows the relationship between their salary, \(P\) pounds, and the length of time, \(T\) years, they have worked.
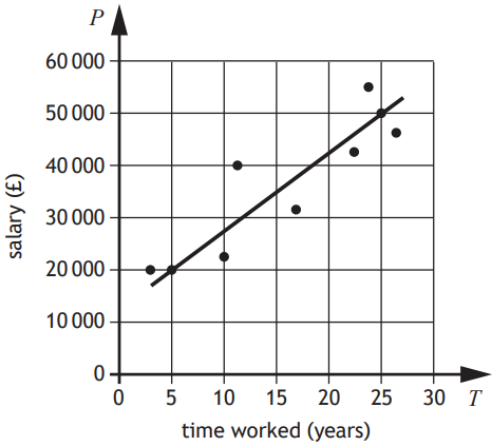
A line of the best fit has been drawn.
(a) Find the equation of the line of best fit in terms of \(P\) and \(T\small.\) Give the equation in its simplest form.
(b) Use your equation from part (a) to estimate the salary of an employee who has worked for the business for 8 years.
Need a tutor for N5 Maths?

Try our free, no-obligation tutor search tool.
Click here to find a tutor in your area. ![]()
If this message continues to display, please refresh the page.
Buy N5 Maths practice papers
Zeta: Five Practice PapersCGP: N5 Maths Exam Practice
Leckie: Revision and Practice
Hodder: N5 Maths Practice Papers
Past paper questions
| • All past paper questions by topic |
| All questions require straight line work. • 2013 Specimen Paper 1 Q6 • 2014 Paper 1 Q6 • 2016 Paper 1 Q5 • 2018 Paper 1 Q7 • 2019 Paper 1 Q6 • 2023 Paper 1 Q7 • 2024 Paper 1 Q9 • 2026 Paper 1 Q6 |
| Standard Grade: Credit (1986–2013) • Exam questions and answers • More exam questions and answers |
Buy our favourite N5 textbook
Zeta National 5+ Maths
Clear and comprehensive.
Progressive exercises.
Includes answers.
Buy from Zeta Press ![]()
Line of best fit worksheets
|
National5Maths.co.uk worksheet • Scatter graphs (no answers) |
|
John Clark - worksheet • Scatter graphs (no answers) |
| Larkhall Academy exercises • Pages 44-49 Ex 1 (no answers) |
Buy N5 Maths revision guides
How to Pass N5 MathsBrightRED: N5 Maths Study Guide
CGP: N5 Maths Revision Guide
Notes and videos
| Video - Miss Brooks Maths |
| • Revision notes - BBC Bitesize • Test yourself - BBC Bitesize |
| Worked example - D R Turnbull |
| Examples - Maths Mutt |
![]()
![]()